Metrics
The metrics endpoint is available since Semaphore version 2.20. If you are running an older version, upgrade to use this feature.
Semaphore exposes a GET /api/metrics endpoint in the standard Prometheus text exposition format, so an existing Prometheus + Grafana setup can monitor the server without any external polling tool.
Two categories of metrics are exposed:
- Process metrics: Go runtime and process stats — goroutine count, memory (heap/resident), CPU time, GC pauses. These come for free from Prometheus's standard Go/process collectors.
- Task metrics, specific to Semaphore's own workload:
semaphore_tasks_running(gauge): number of tasks currently running, right now.semaphore_tasks_total{status}(counter): total tasks that have finished, broken down by outcome:success,error,stopped.
Both update in real time as tasks change state — there's no polling delay, since the counters are updated directly inside the task runner at the moment a task's status actually changes.
Enabling metrics
The endpoint is disabled by default and requires HTTP Basic Auth with a static, service-level credential — not tied to any user account, since Prometheus can't do interactive login:
{
  "metrics": {
    "enabled": true,
    "username": "prometheus",
    "password": "changeme"
  }
}
Or using environment variables:
SEMAPHORE_METRICS_ENABLED=true
SEMAPHORE_METRICS_USERNAME=prometheus
SEMAPHORE_METRICS_PASSWORD=changeme
Metrics options
| Parameter | Environment Variables | Description |
|---|---|---|
enabled | SEMAPHORE_METRICS_ENABLED | Turn the /api/metrics endpoint on or off. Disabled by default. |
username | SEMAPHORE_METRICS_USERNAME | Basic Auth username required to scrape the endpoint. |
password | SEMAPHORE_METRICS_PASSWORD | Basic Auth password required to scrape the endpoint (sensitive). |
If enabled is left false (the default), or the credentials are missing or wrong, every request to /api/metrics returns 401 Unauthorized.
Scraping with Prometheus
Configure a scrape job with basic_auth using the credentials above:
scrape_configs:
  - job_name: semaphore
    metrics_path: /api/metrics
    basic_auth:
      username: prometheus
      password: changeme
    static_configs:
      - targets: ["<semaphore-host>:3000"]
Viewing metrics in Grafana
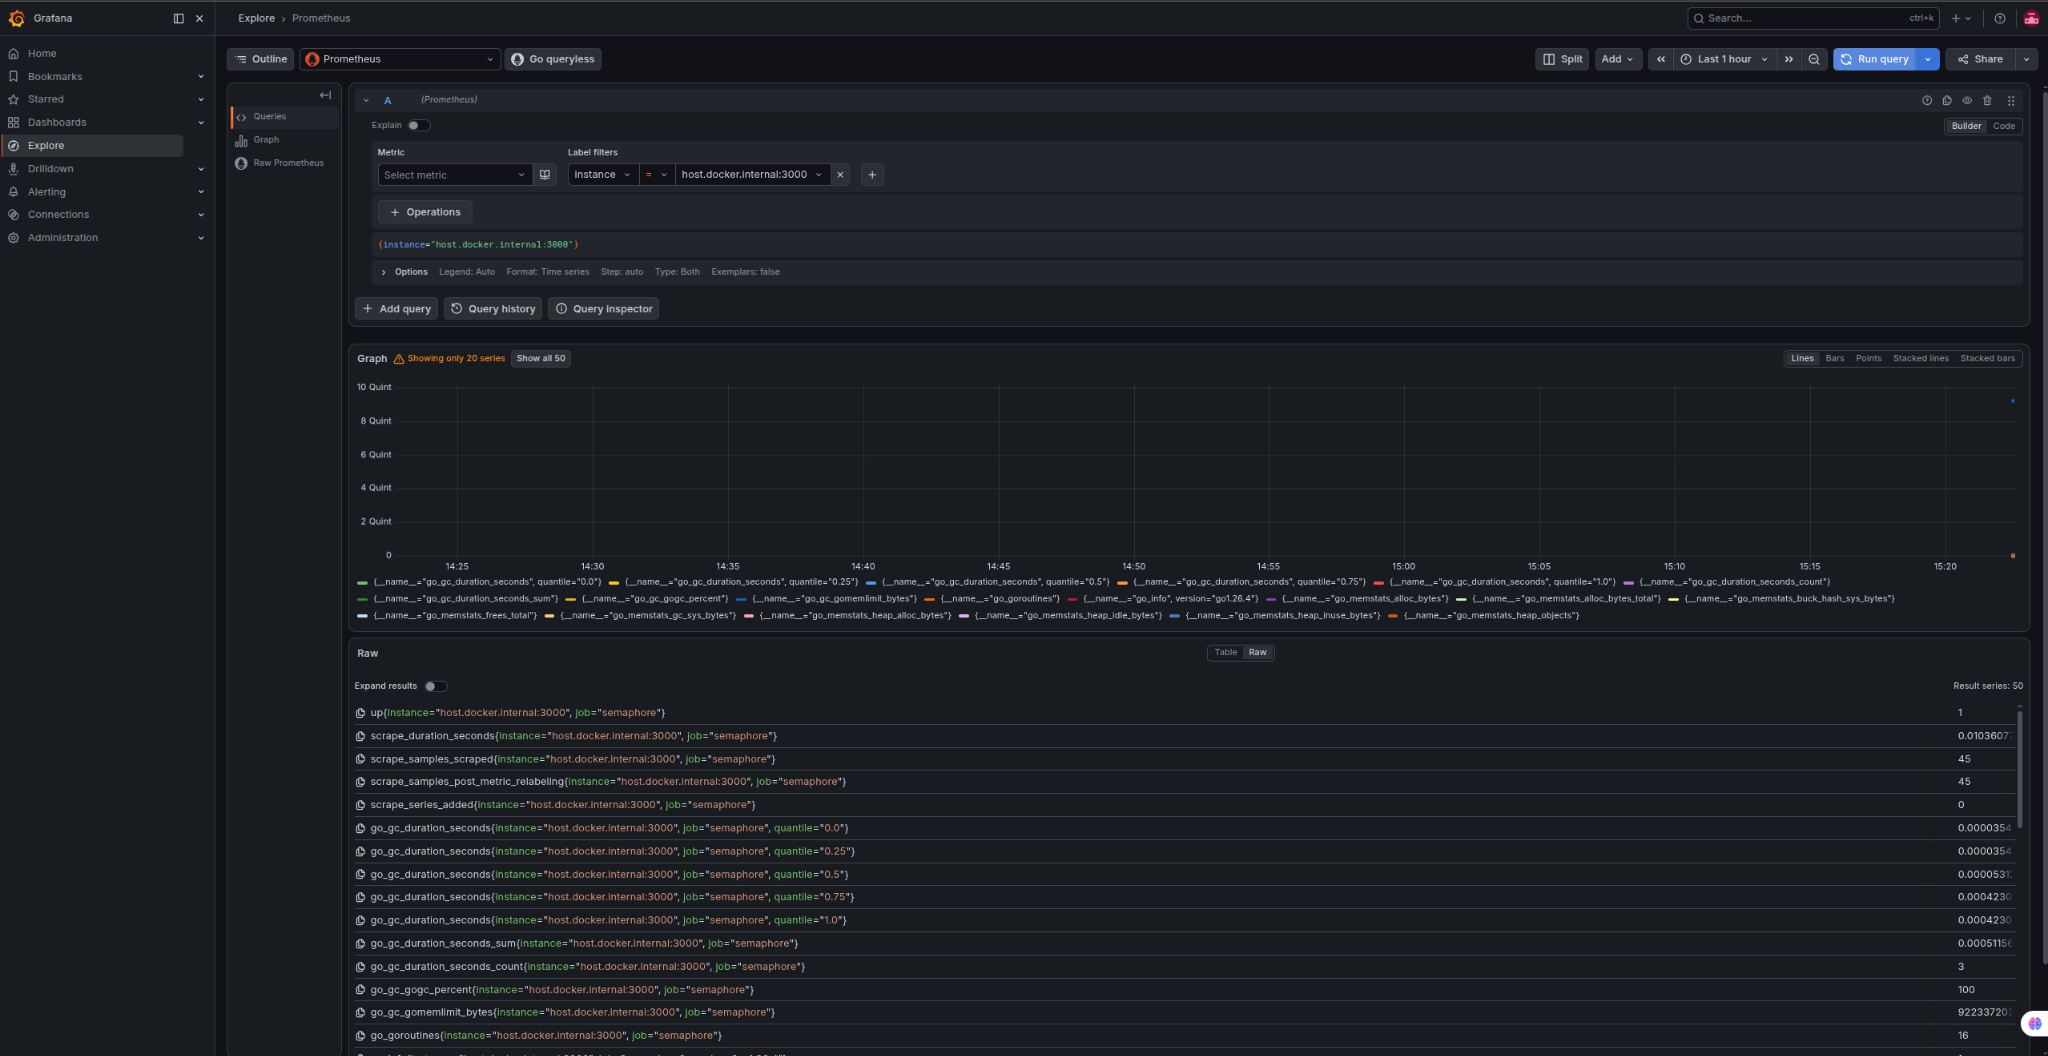
Grafana's Explore view lets you run any PromQL query against the metrics directly and see the raw results, without building a dashboard first:
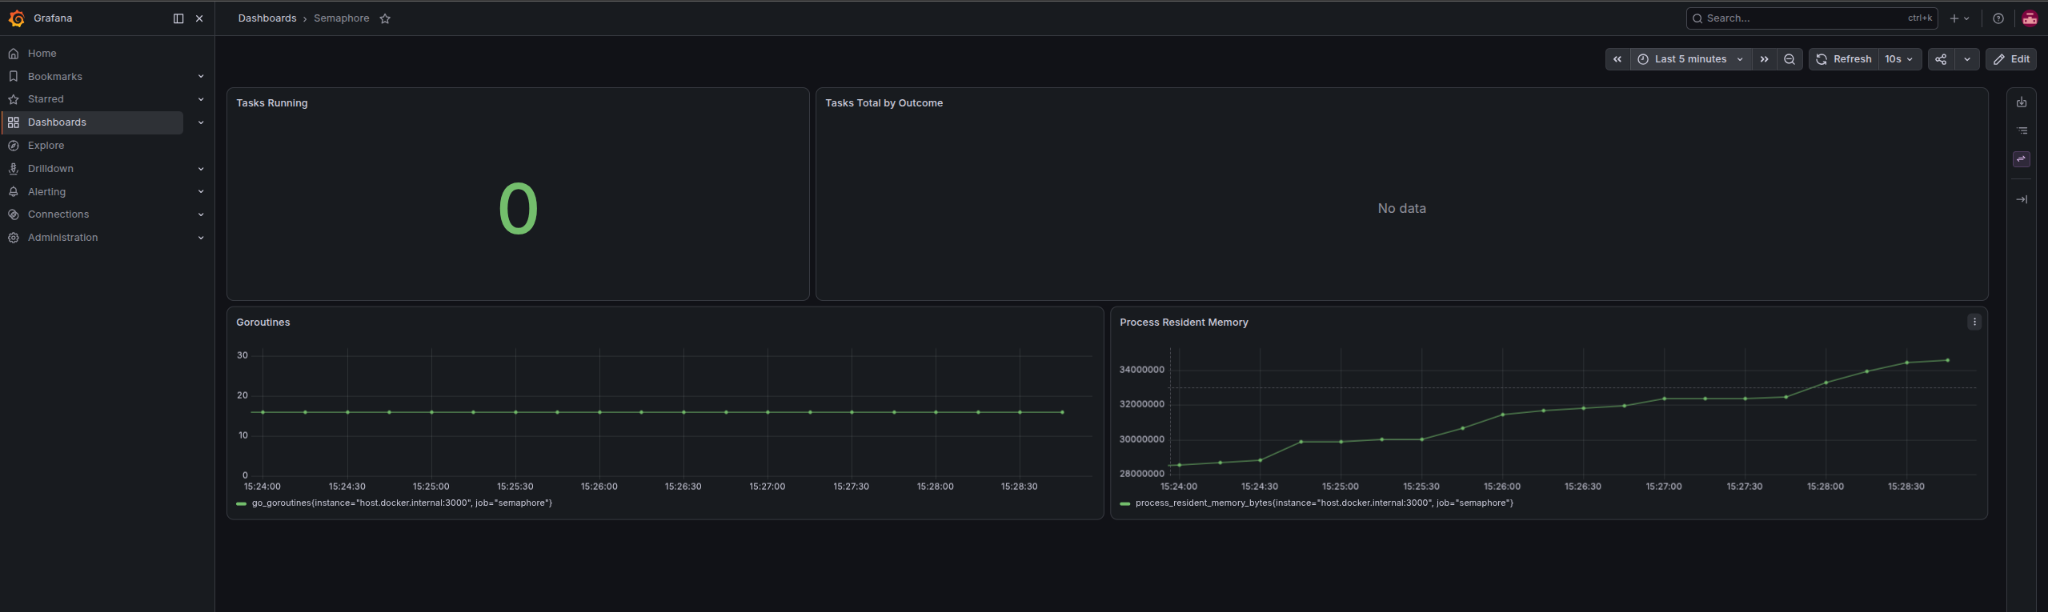
A dashboard can then be built on top of the same metrics — this example covers both categories with four panels: tasks running, tasks total by outcome, goroutines, and process resident memory.