Stats
The Stats tab of the project dashboard shows how tasks in the project finished over time.
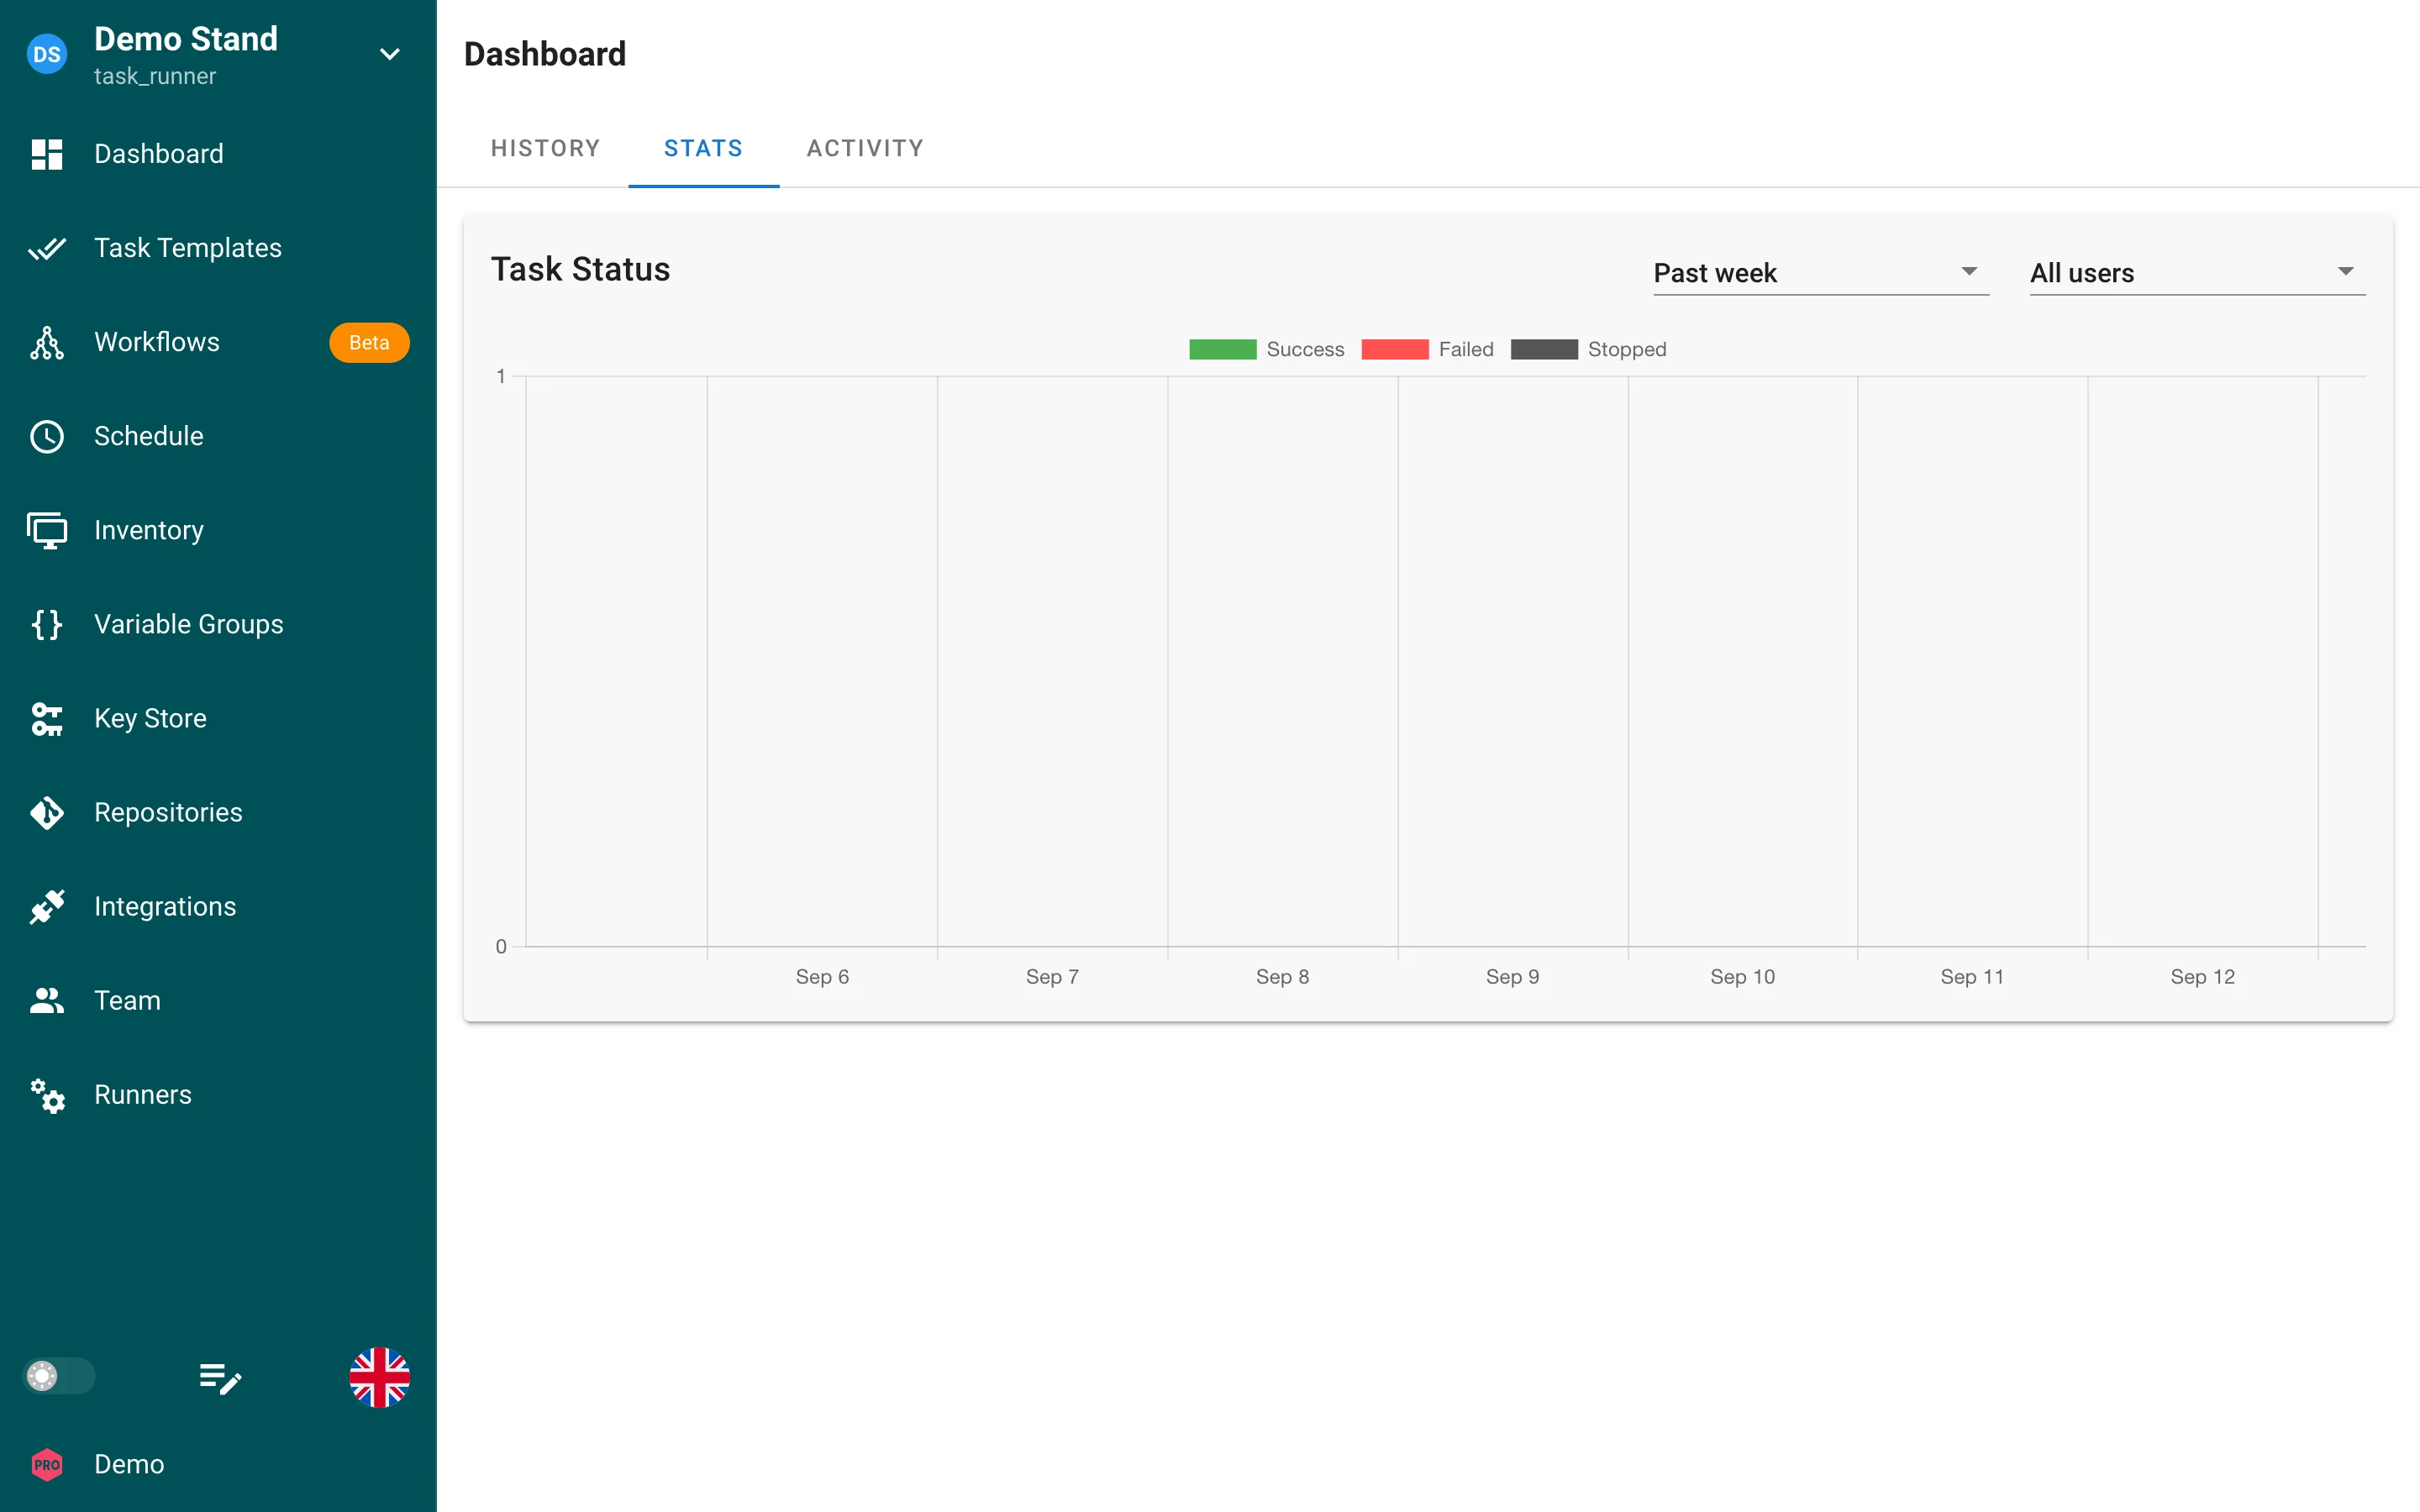
The Task Status chart counts tasks per day by their final status:
- Success: the task finished without errors.
- Failed: the task ended with an error.
- Stopped: the task was stopped by a user.
Two filters above the chart narrow the data:
| Filter | Options |
|---|---|
| Period | Past week, Past month, Past year |
| User | All users, or a single member of the project. Tasks started by schedules and integrations have no user and are included only in All users. |
The same chart is available for a single template on the Details tab of the template page.
To see individual runs instead of aggregated numbers, use the History tab.